The Mall - Powerhouse

Mall-101

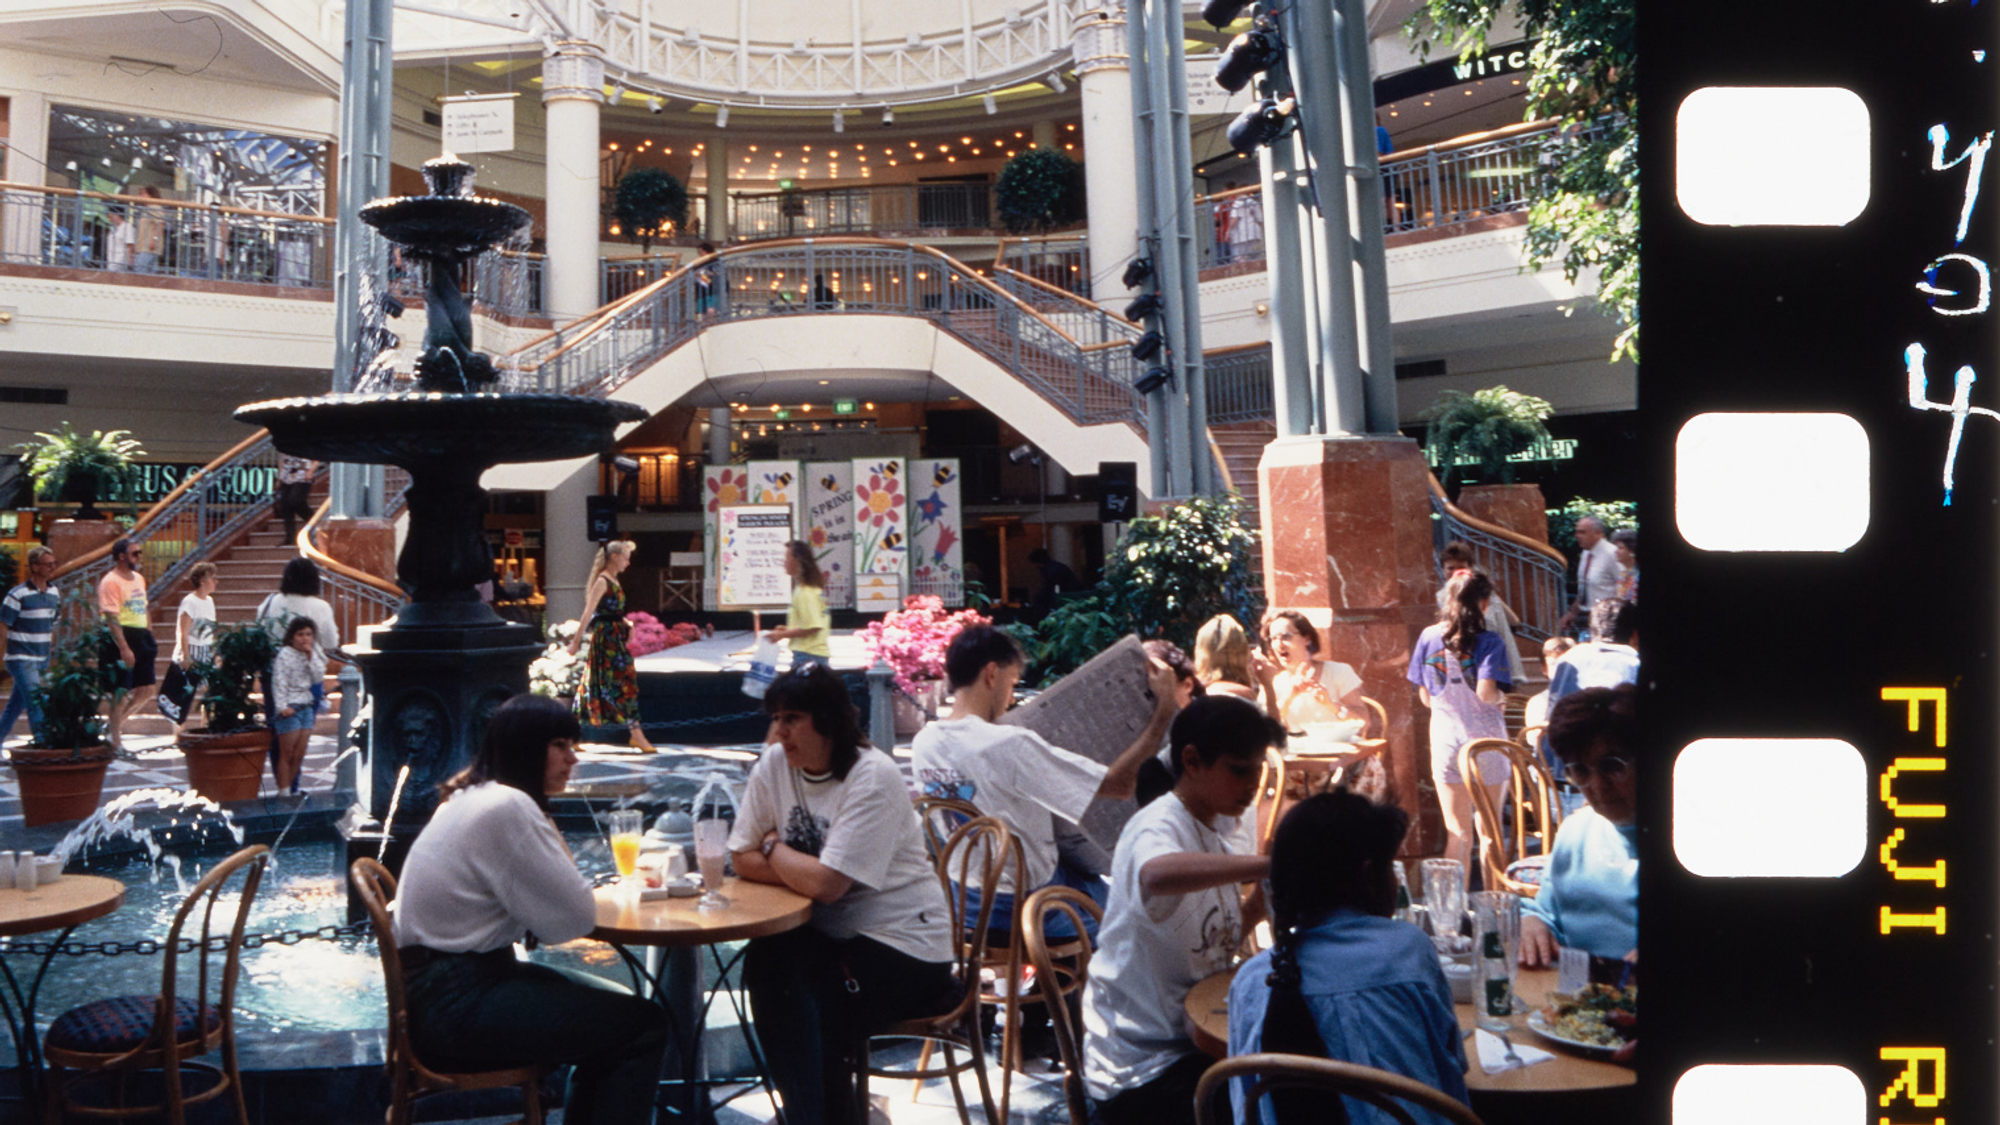
A film slide of a shopping mall atrium: people at café tables around a tiered fountain, a curved staircase and balconies behind, the Fuji film edge on the right

Category

Exhibition Interactive

Client

Powerhouse × OMA/AMO

Year

2026

Role

Senior Developer

[ The Mall ]
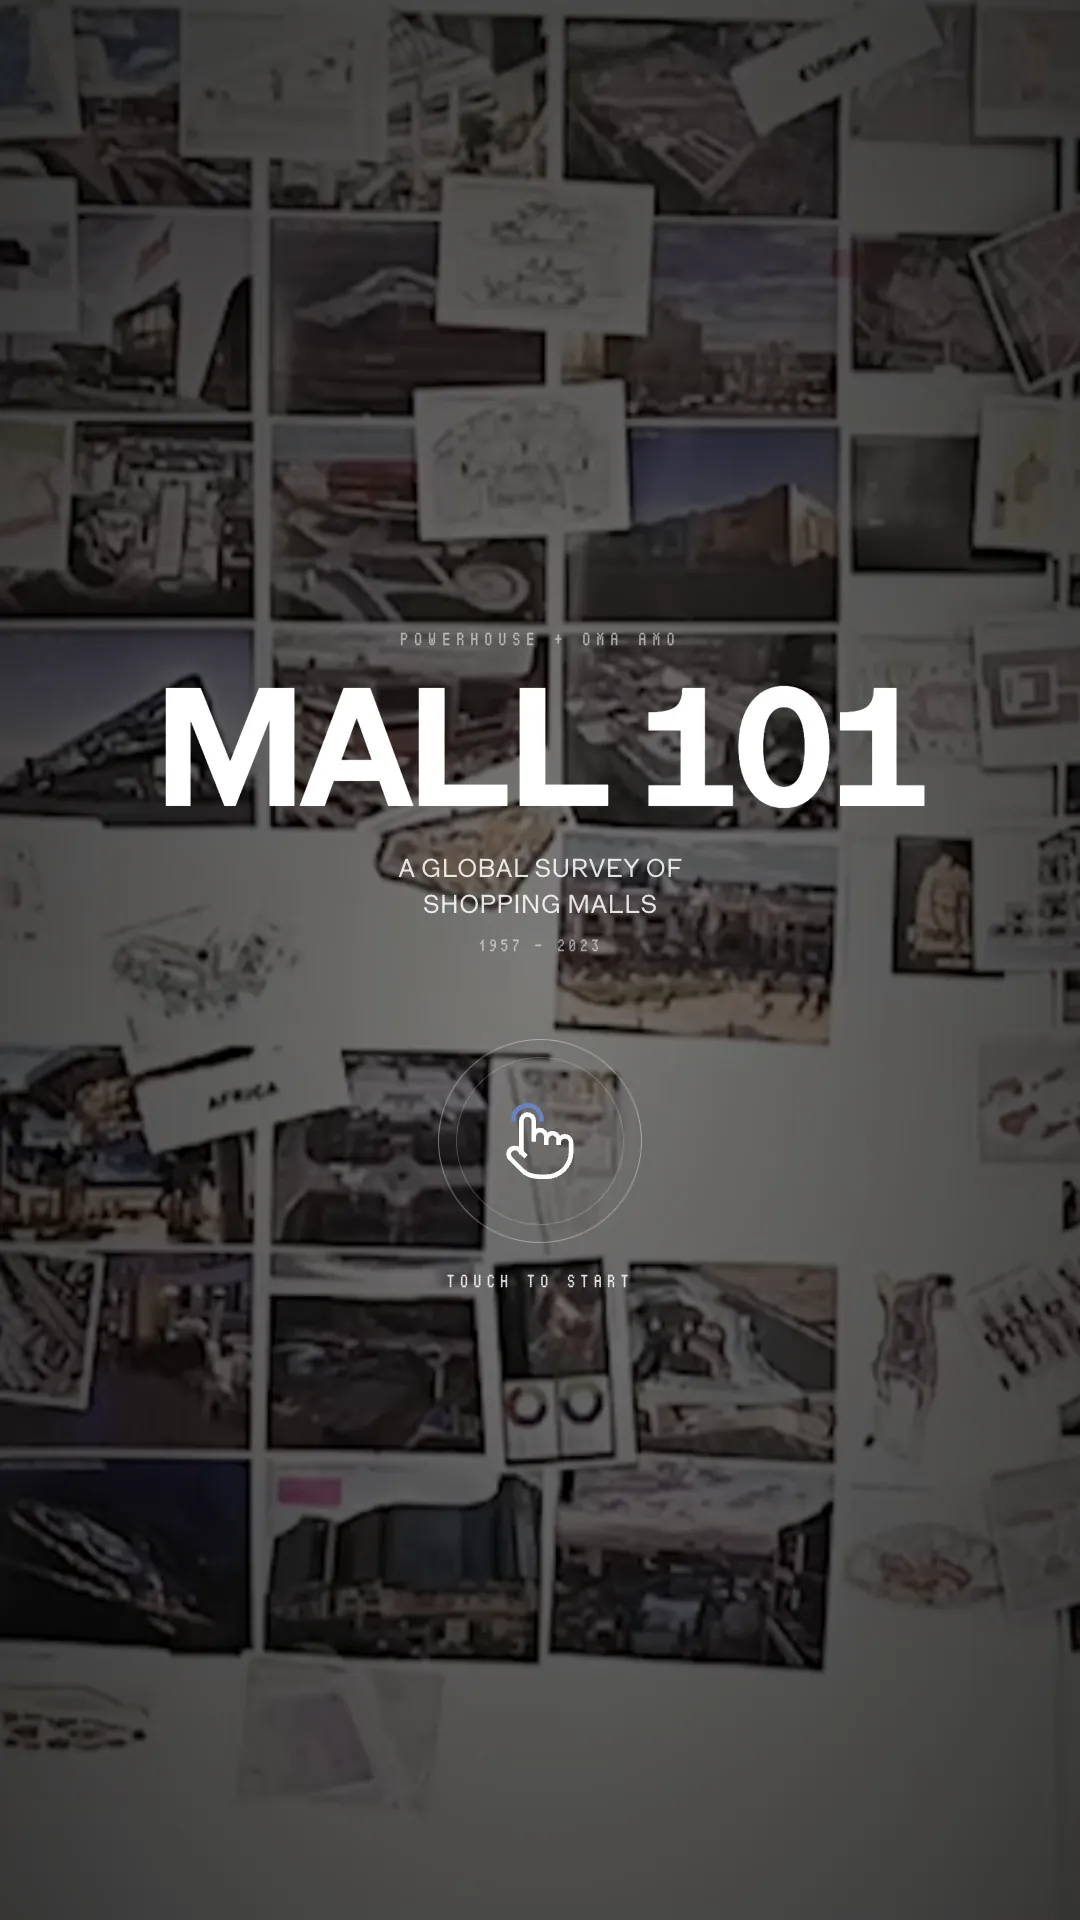
Mall 101 attract screen: the title over a looping film, with a Touch to start prompt
[ Attract ]
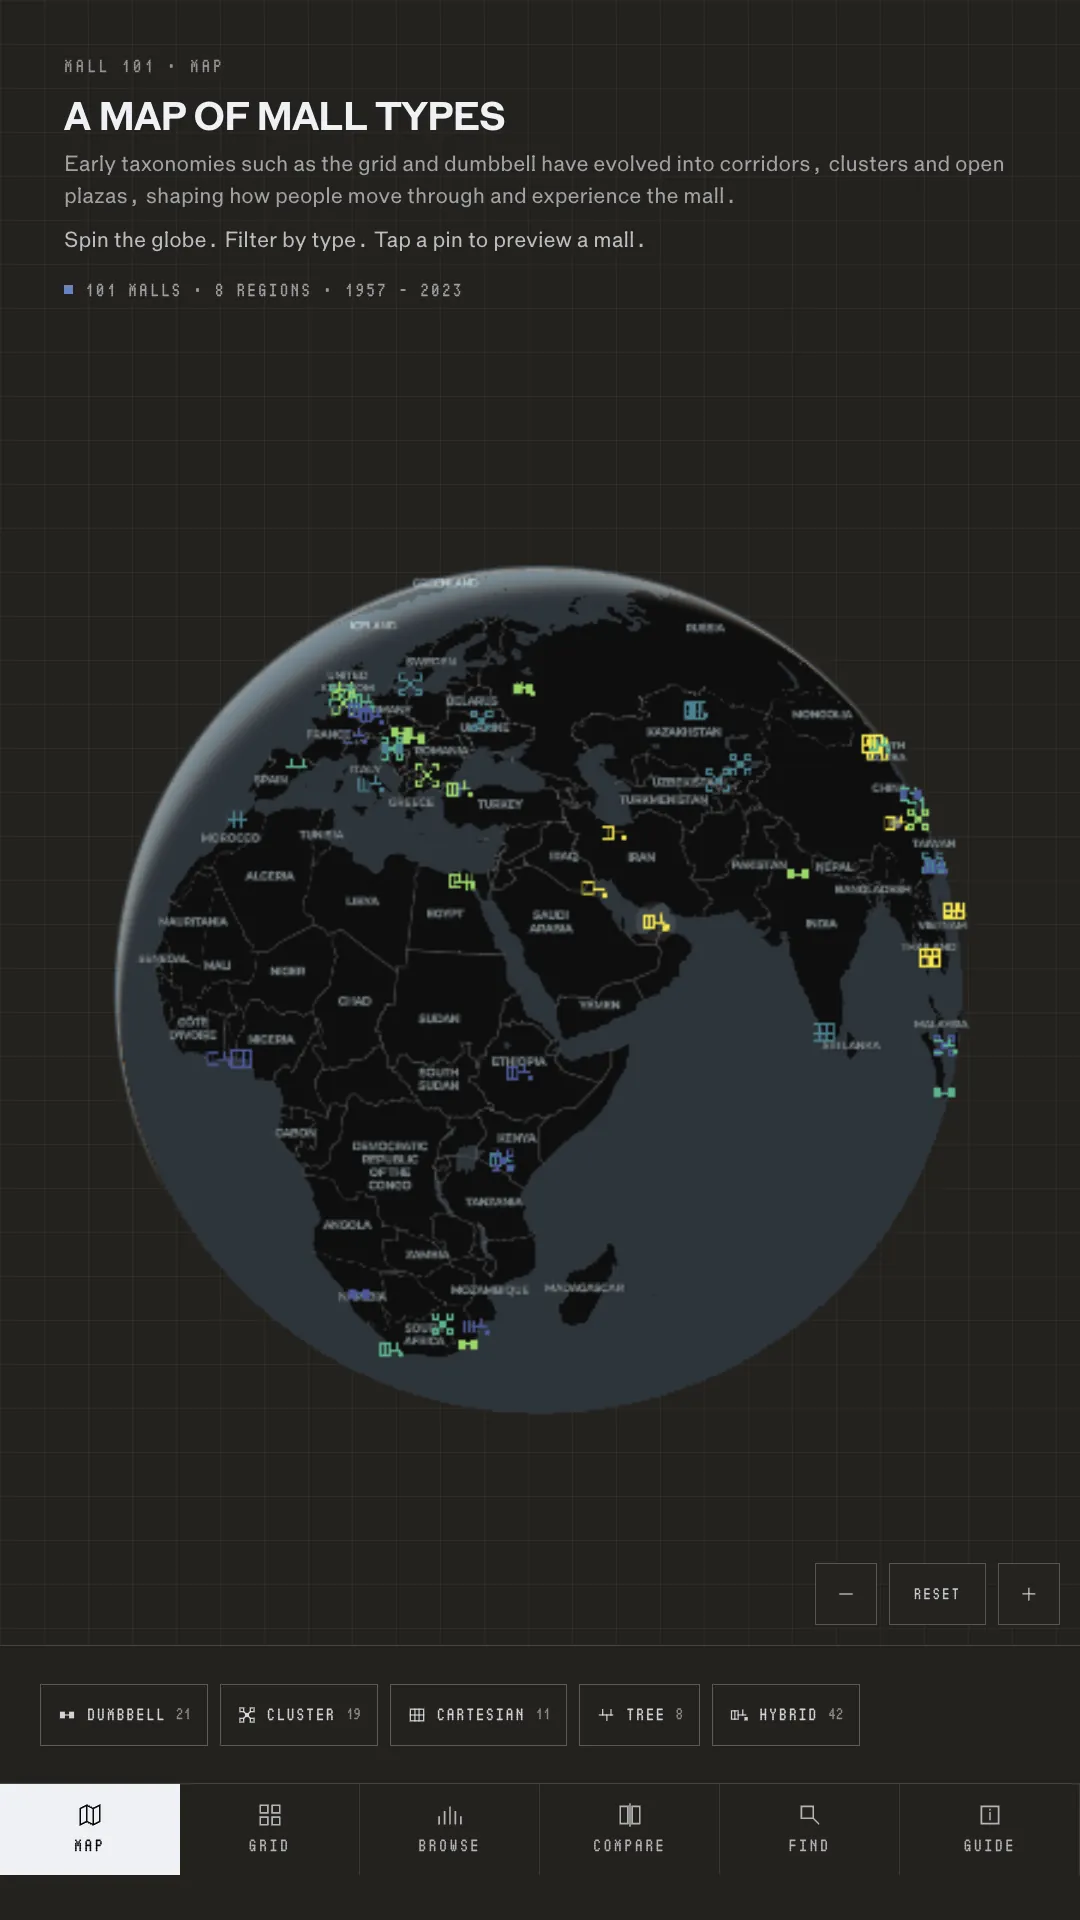
Map view: the 101 malls on a dark globe, with filters for the five spatial types along the bottom
[ Map ]
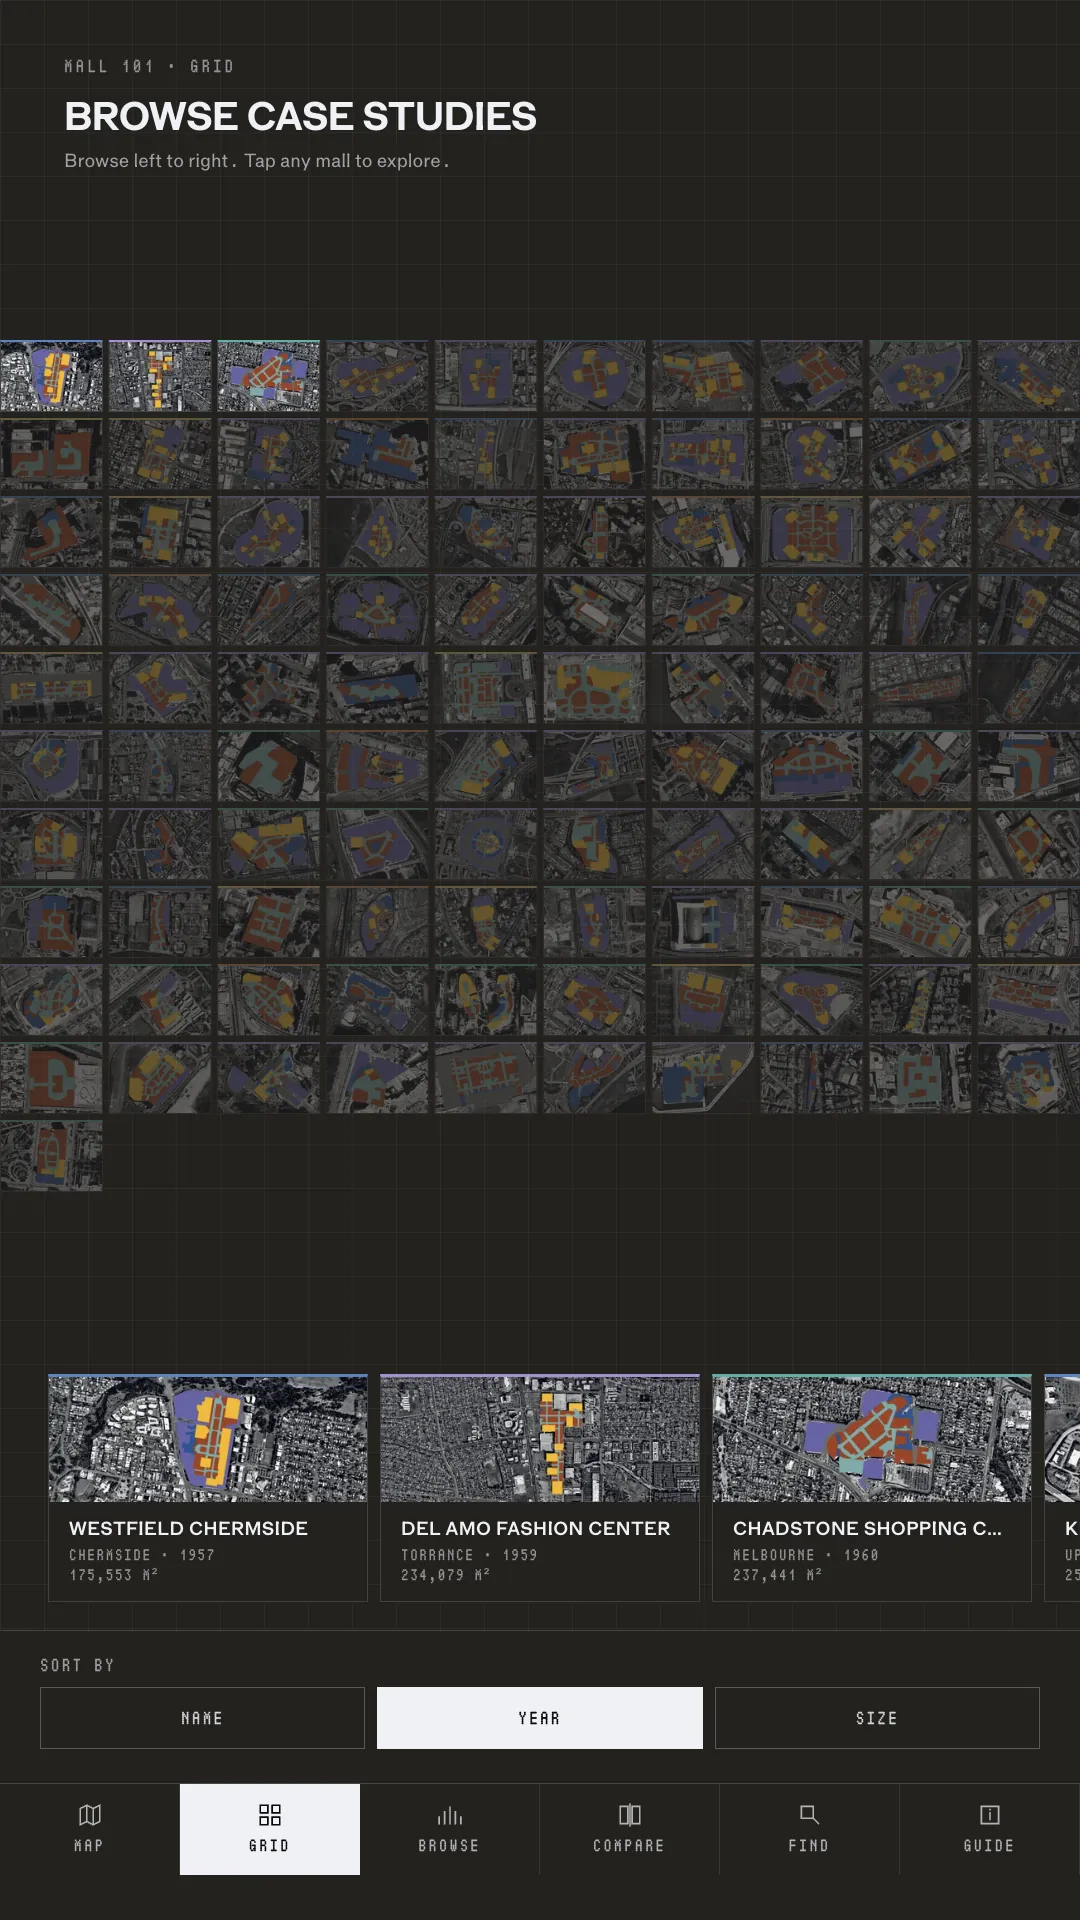
Grid view: every mall's satellite plan as a wall of tiles above a swipeable card shelf
[ Grid ]
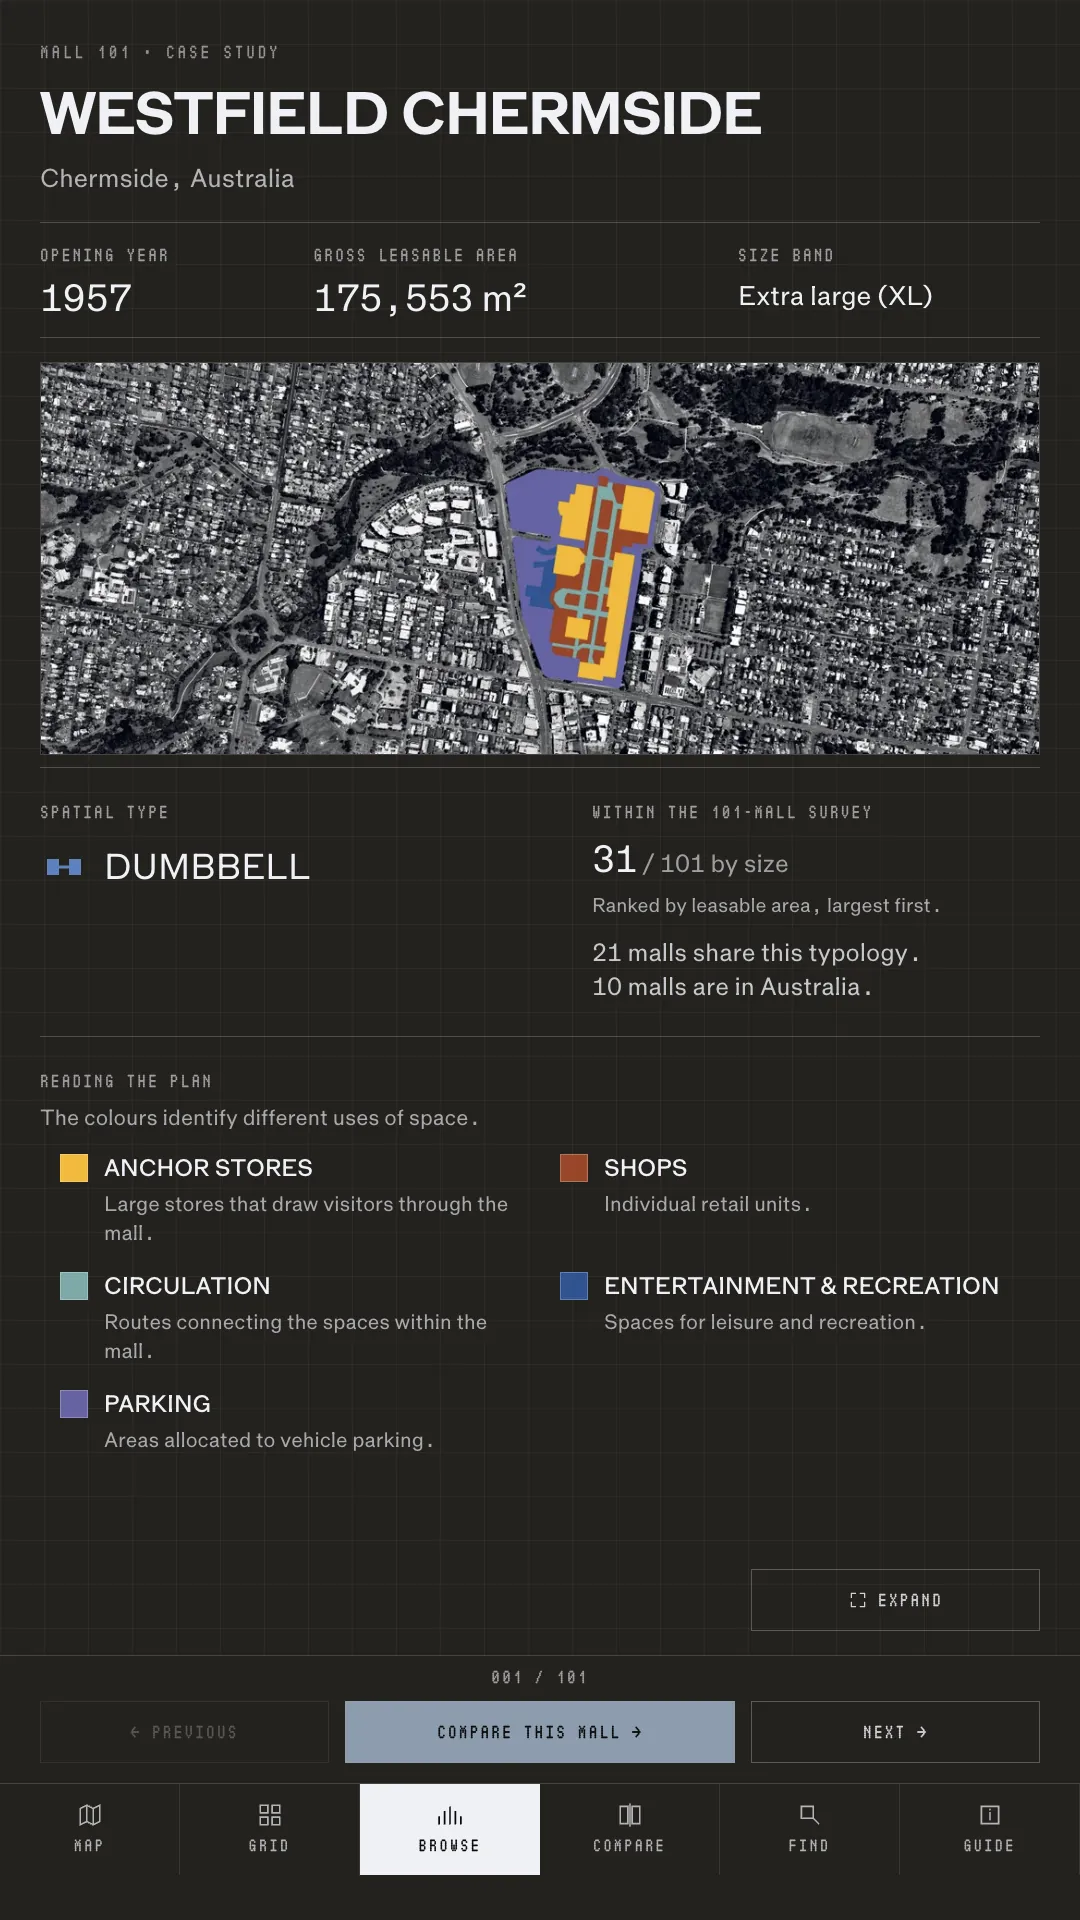
Case study for Westfield Chermside: opening year, gross leasable area and size band over its satellite plan and colour key
[ Case study ]

[ Overview ]

[ 101 malls · 48 countries · 1957 – 2023 ]

A portrait touchscreen kiosk for The Mall at Powerhouse, where visitors compare 101 shopping malls from 1957 to 2023 by form, size and place.

Mall 101 is the interactive companion to OMA/AMO's survey of 101 shopping malls, made for The Mall, the exhibition Powerhouse created with OMA/AMO. Led by OMA's Managing Partner David Gianotten and drawing on the practice's research in The Harvard Guide to Shopping, the exhibition looks at how the shopping mall evolved and what it has meant.

The kiosk puts the whole survey on one portrait touchscreen in the gallery. Visitors can spin a globe of all 101 malls, scan every plan at the same scale, open a mall's satellite plan, or set two malls side by side.

I built it as Senior Developer at Powerhouse: the dataset and image pipeline, the interface, and the monitoring and handover that keep it running on the gallery floor.

Project Information

[ Exhibition Interactive ]

[ The Challenge ]

Make 101 malls from six decades comparable on one screen, for anyone who walks up to it.

The survey runs from 1957 to 2023 across 48 countries, and the malls differ wildly in scale, form and gross leasable area. All of it had to read on a single 1080 × 1920 portrait screen, work for someone in a wheelchair, and run unattended in the gallery for days at a time.
[ The Approach ]

A fixed portrait stage, one dataset, and every plan drawn at the same scale.

The kiosk is drawn on a fixed 1080 × 1920 stage that scales evenly to the screen, and a small state machine moves visitors between Attract, Map, Grid, case study, Compare, Find and Guide. MapLibre places every mall on a globe at its true coordinates, coloured by size and marked with one of five spatial types. GSAP handles the carousel and the motion.

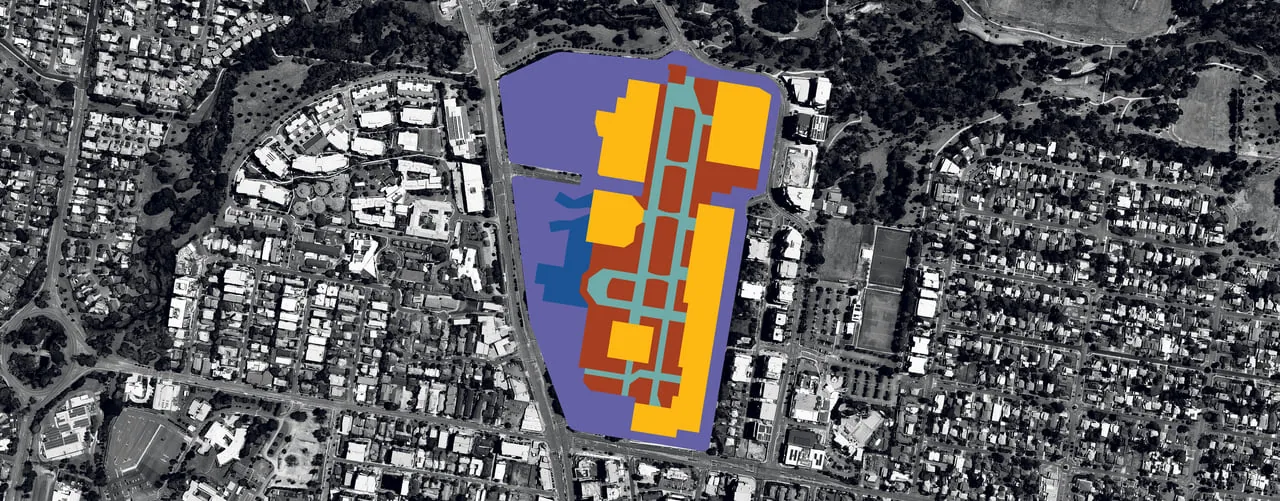
Every mall has a satellite photo with its plan recoloured to the legend palette. The 101 photos and 303 pre-cut crops live in Cloudflare R2 behind a Worker. Tap targets all sit in the bottom 60% of the screen, within seated reach, and none is smaller than 62 px. A test script checks those numbers on every change rather than leaving them to review.

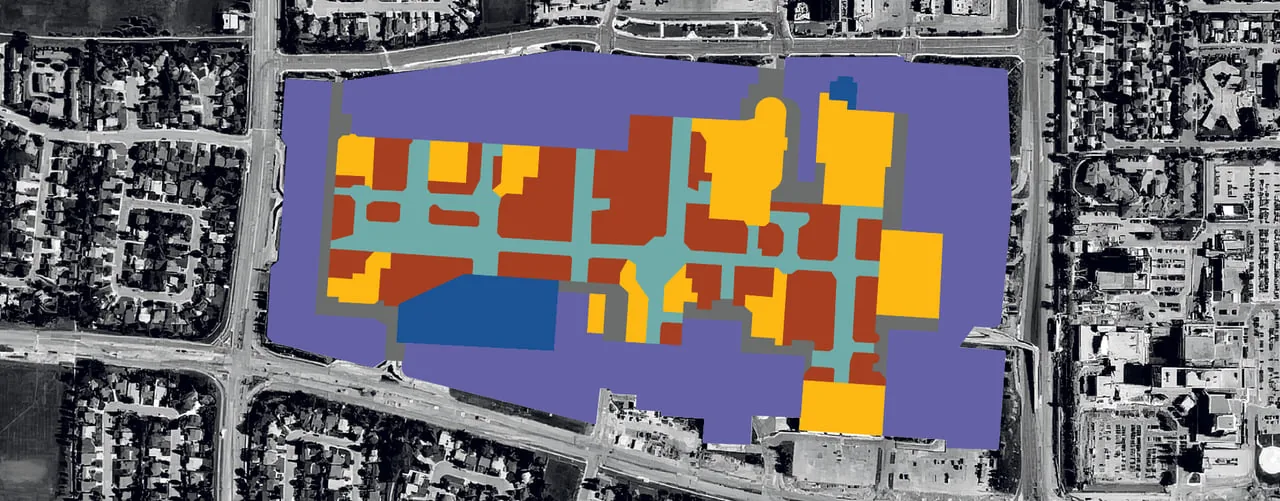
Westfield Chermside from above, its plan coloured by use: anchor stores, shops, circulation and parking
[ 1957 · Westfield Chermside ]
Westfield Parramatta from above, its plan coloured by use: shops, circulation and entertainment
[ 1975 · Westfield Parramatta ]
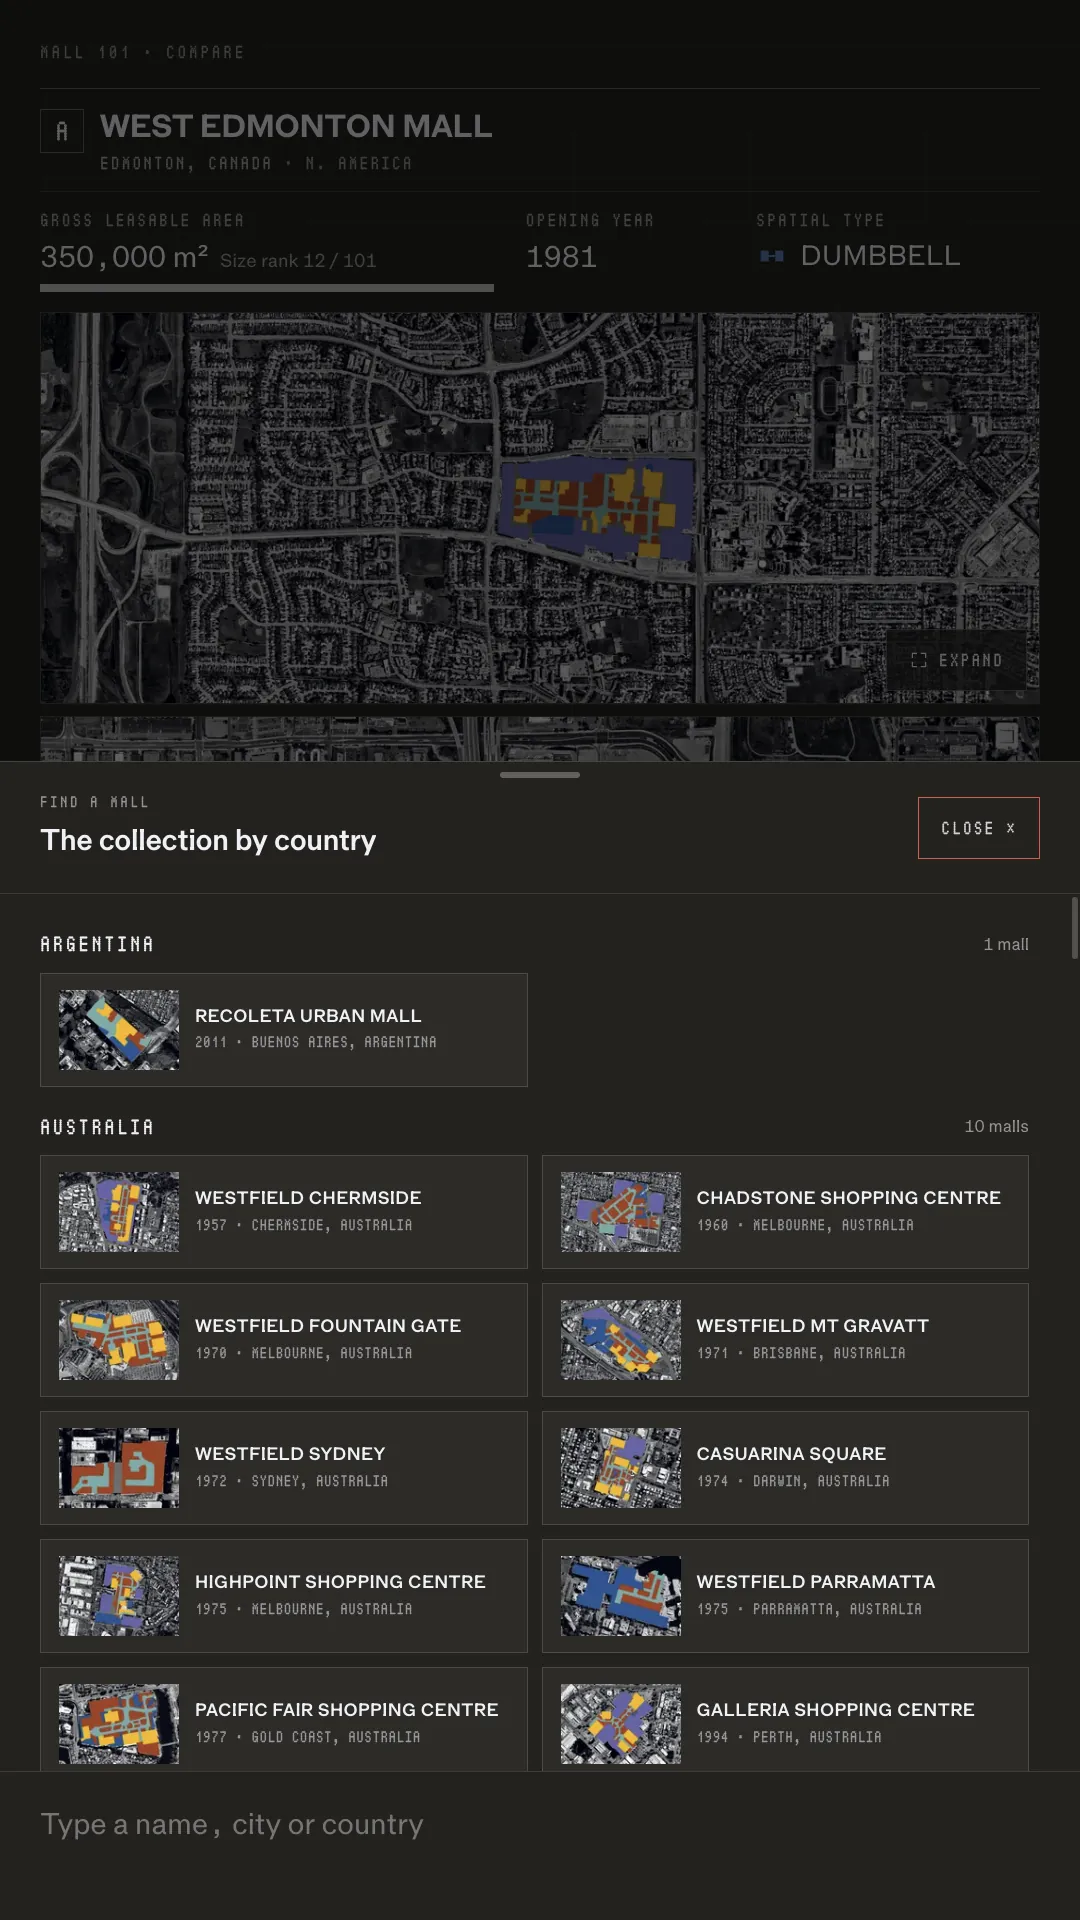
West Edmonton Mall from above, its long plan coloured by use and ringed by parking
[ 1981 · West Edmonton Mall ]
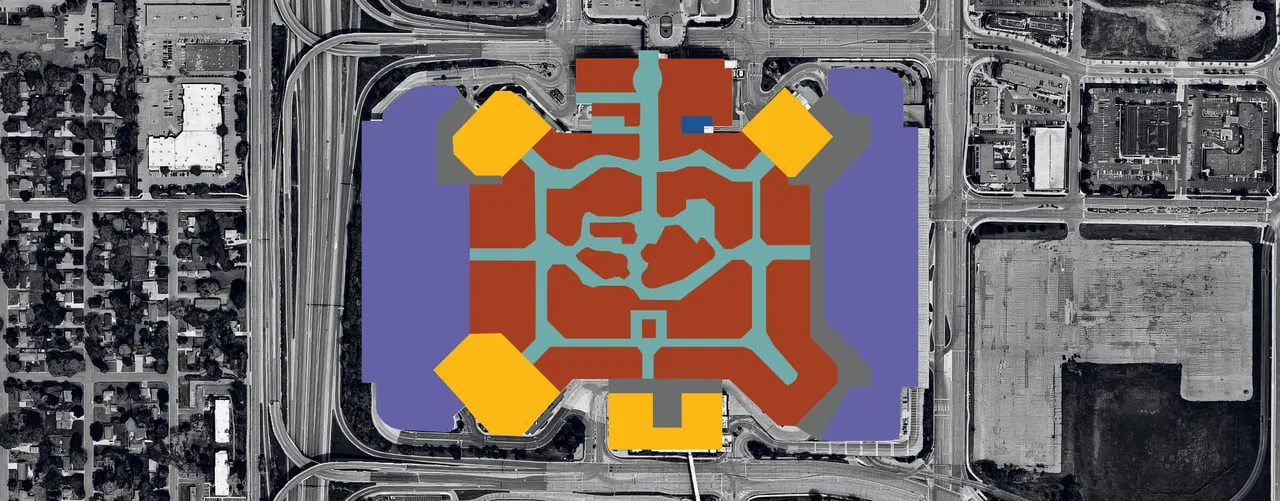
Mall of America from above, a square plan with an anchor store at each corner, ringed by parking
[ 1992 · Mall of America ]
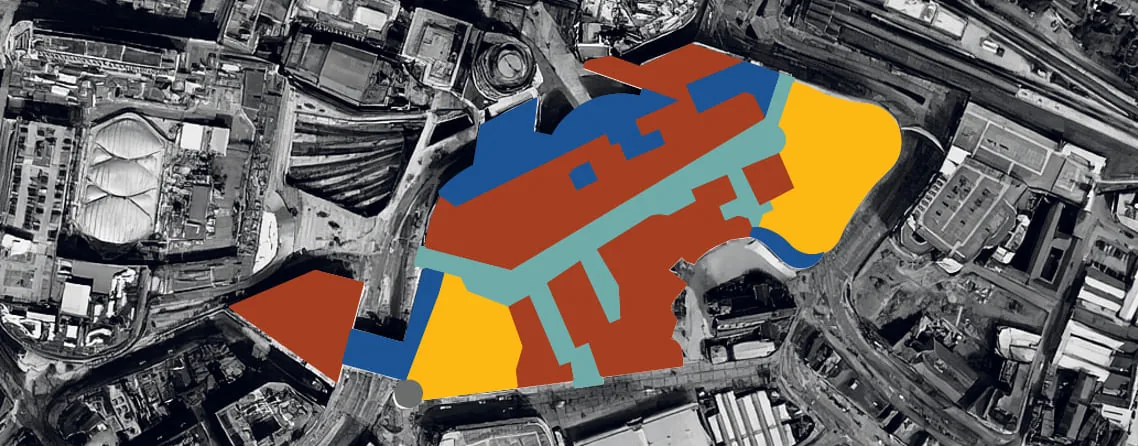
Bullring in Birmingham from above, its irregular plan coloured by use between rail lines and roads
[ 2001 · Bullring ]
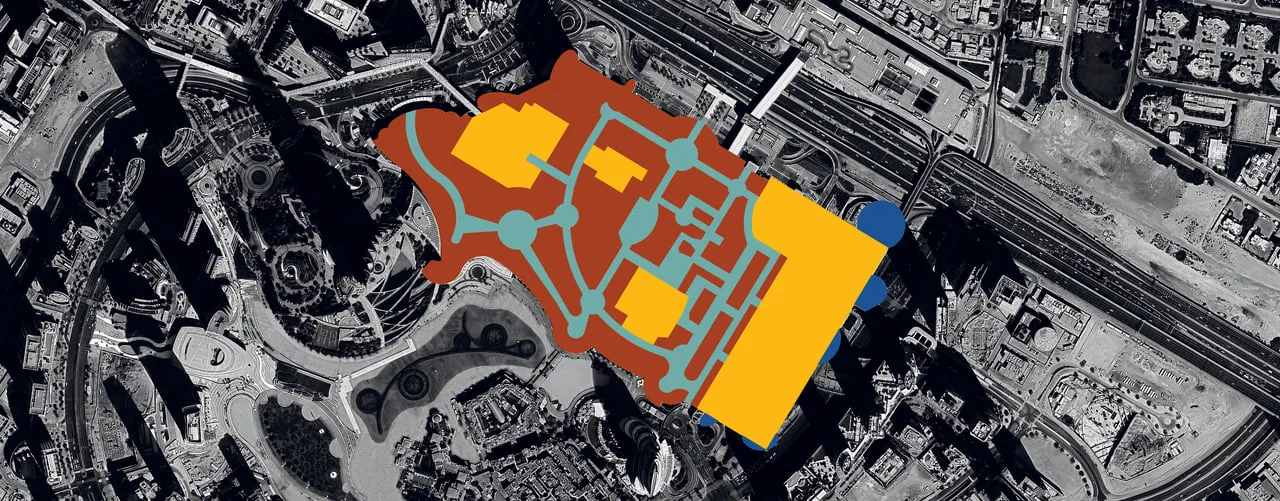
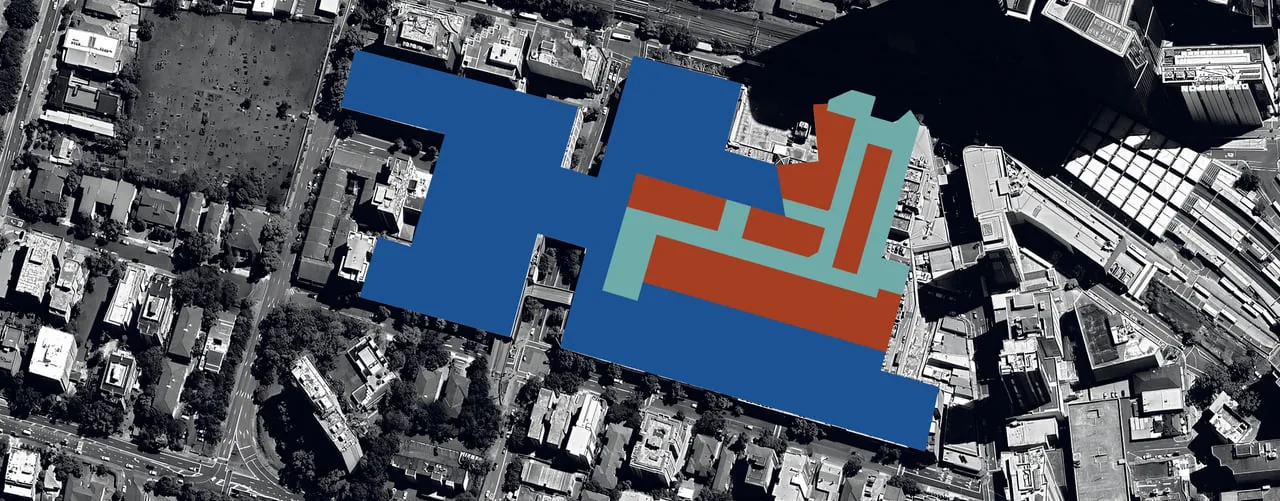
Dubai Mall from above, its plan coloured by use beside the city's towers
[ 2008 · Dubai Mall ]
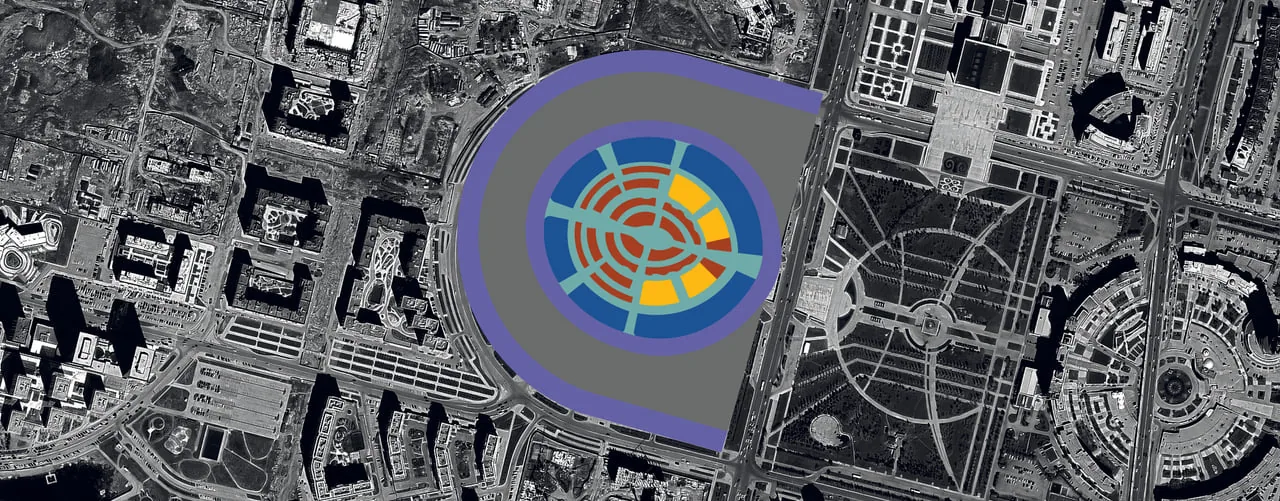
Khan Shatyr in Astana from above, a round plan of concentric rings coloured by use
[ 2010 · Khan Shatyr ]
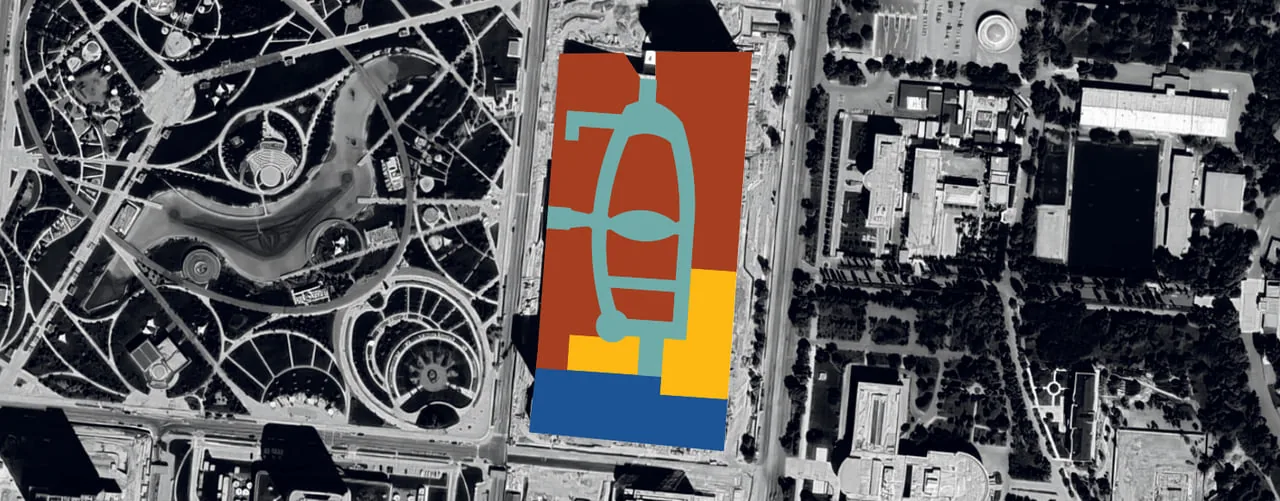
Tashkent City Mall from above, a rectangular plan coloured by use beside a park
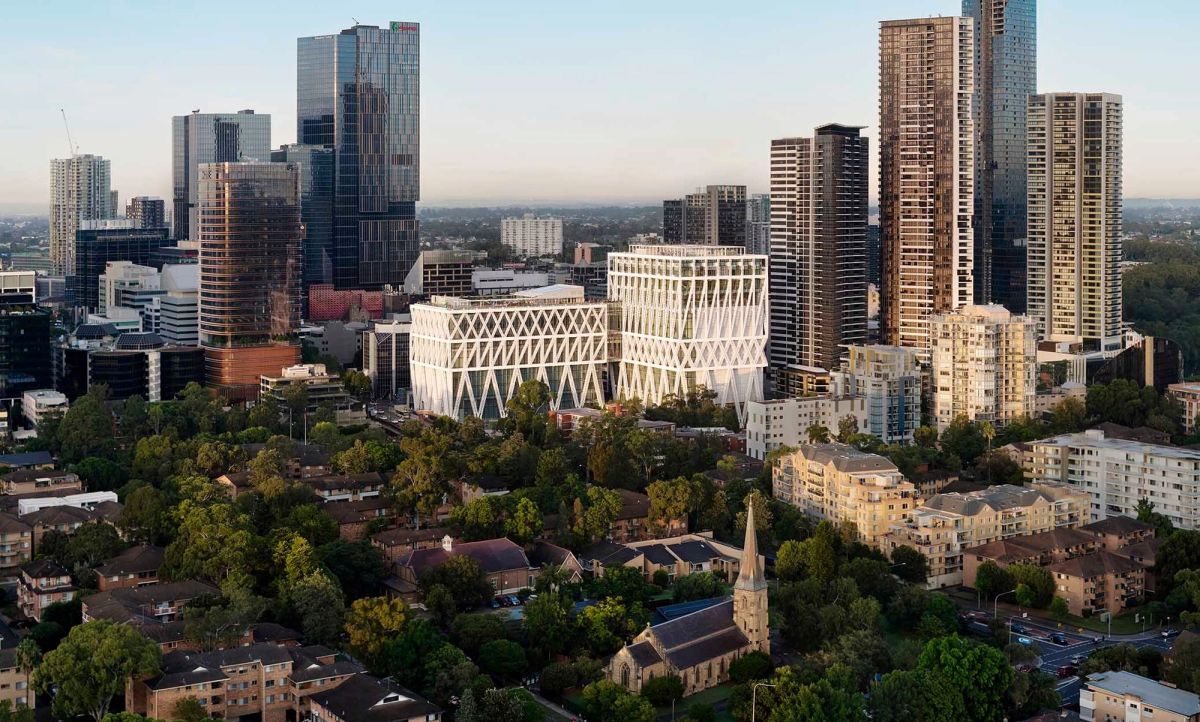
[ 2023 · Tashkent City Mall ]

[ The Outcome ]

A kiosk that looks after itself on the gallery floor and says when something is wrong.

After 90 seconds without a touch the kiosk asks whether you're still exploring, then resets to the attract screen. It repairs what it can on its own, and the gallery player checks in with Sentry every five minutes, so silence is the alarm.

The kiosk build was frozen on 23 October 2026 and only changes through a deliberate redeploy. A handover site documents how to run it, and the same codebase carries a landscape browser version of the survey, parked for now.

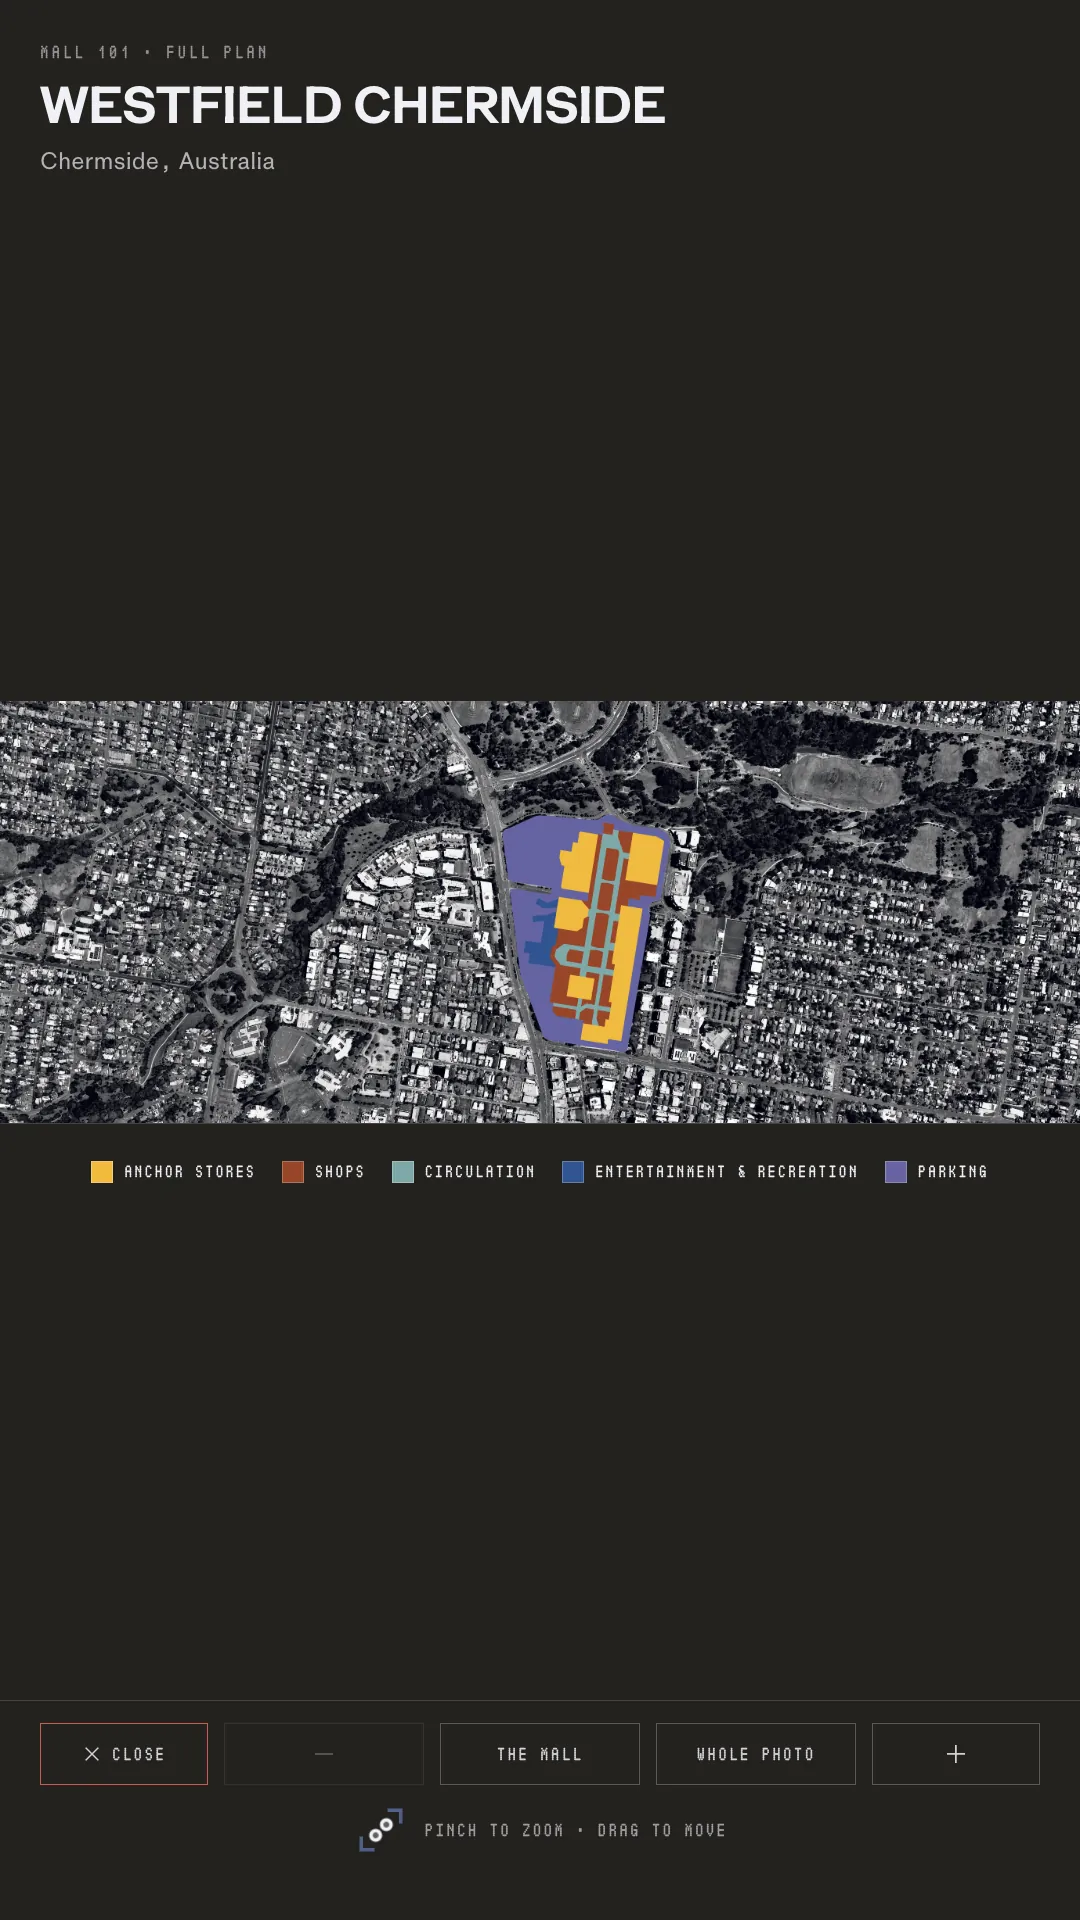
Full-plan viewer: Westfield Chermside's satellite plan across the screen, with zoom controls
[ Full plan ]
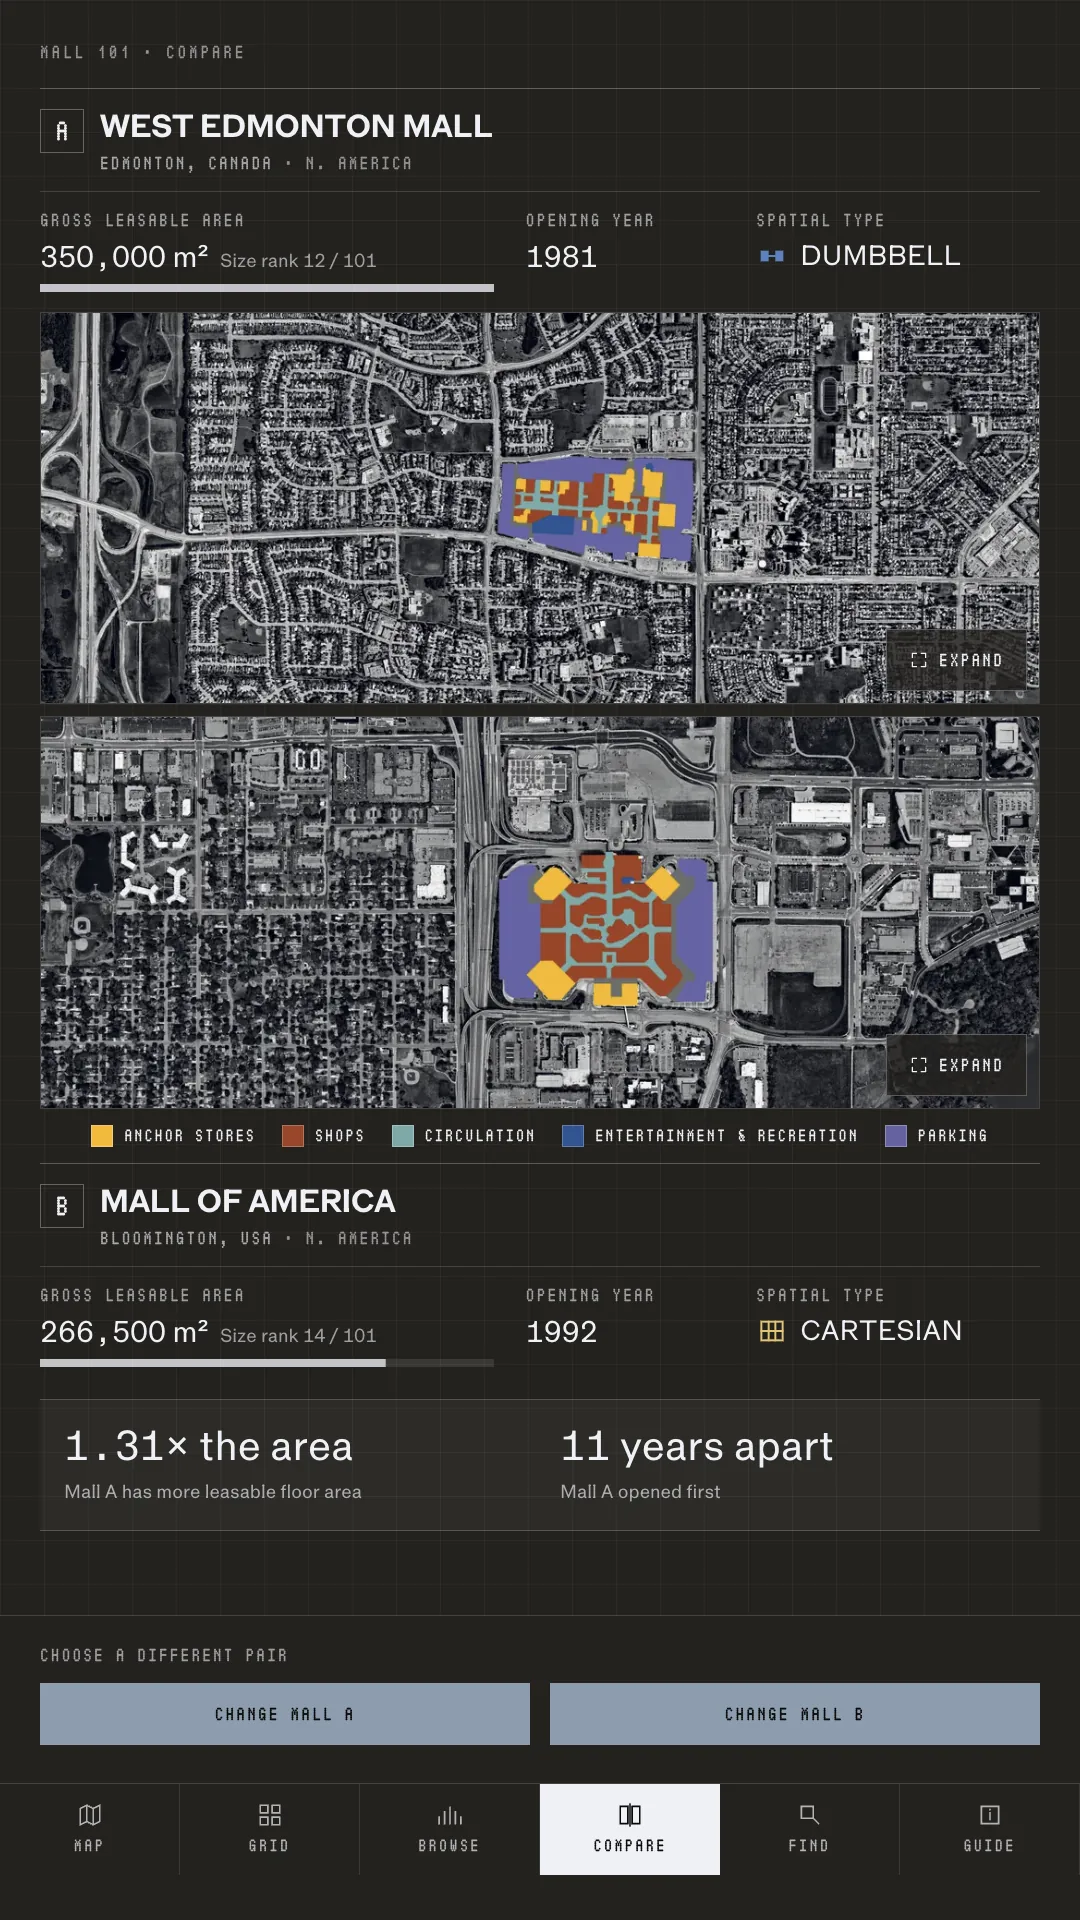
Compare view: West Edmonton Mall above Mall of America, with area, opening year and spatial type side by side
[ Compare ]
Find sheet: the collection listed by country, each mall as a card under its country
[ Find ]
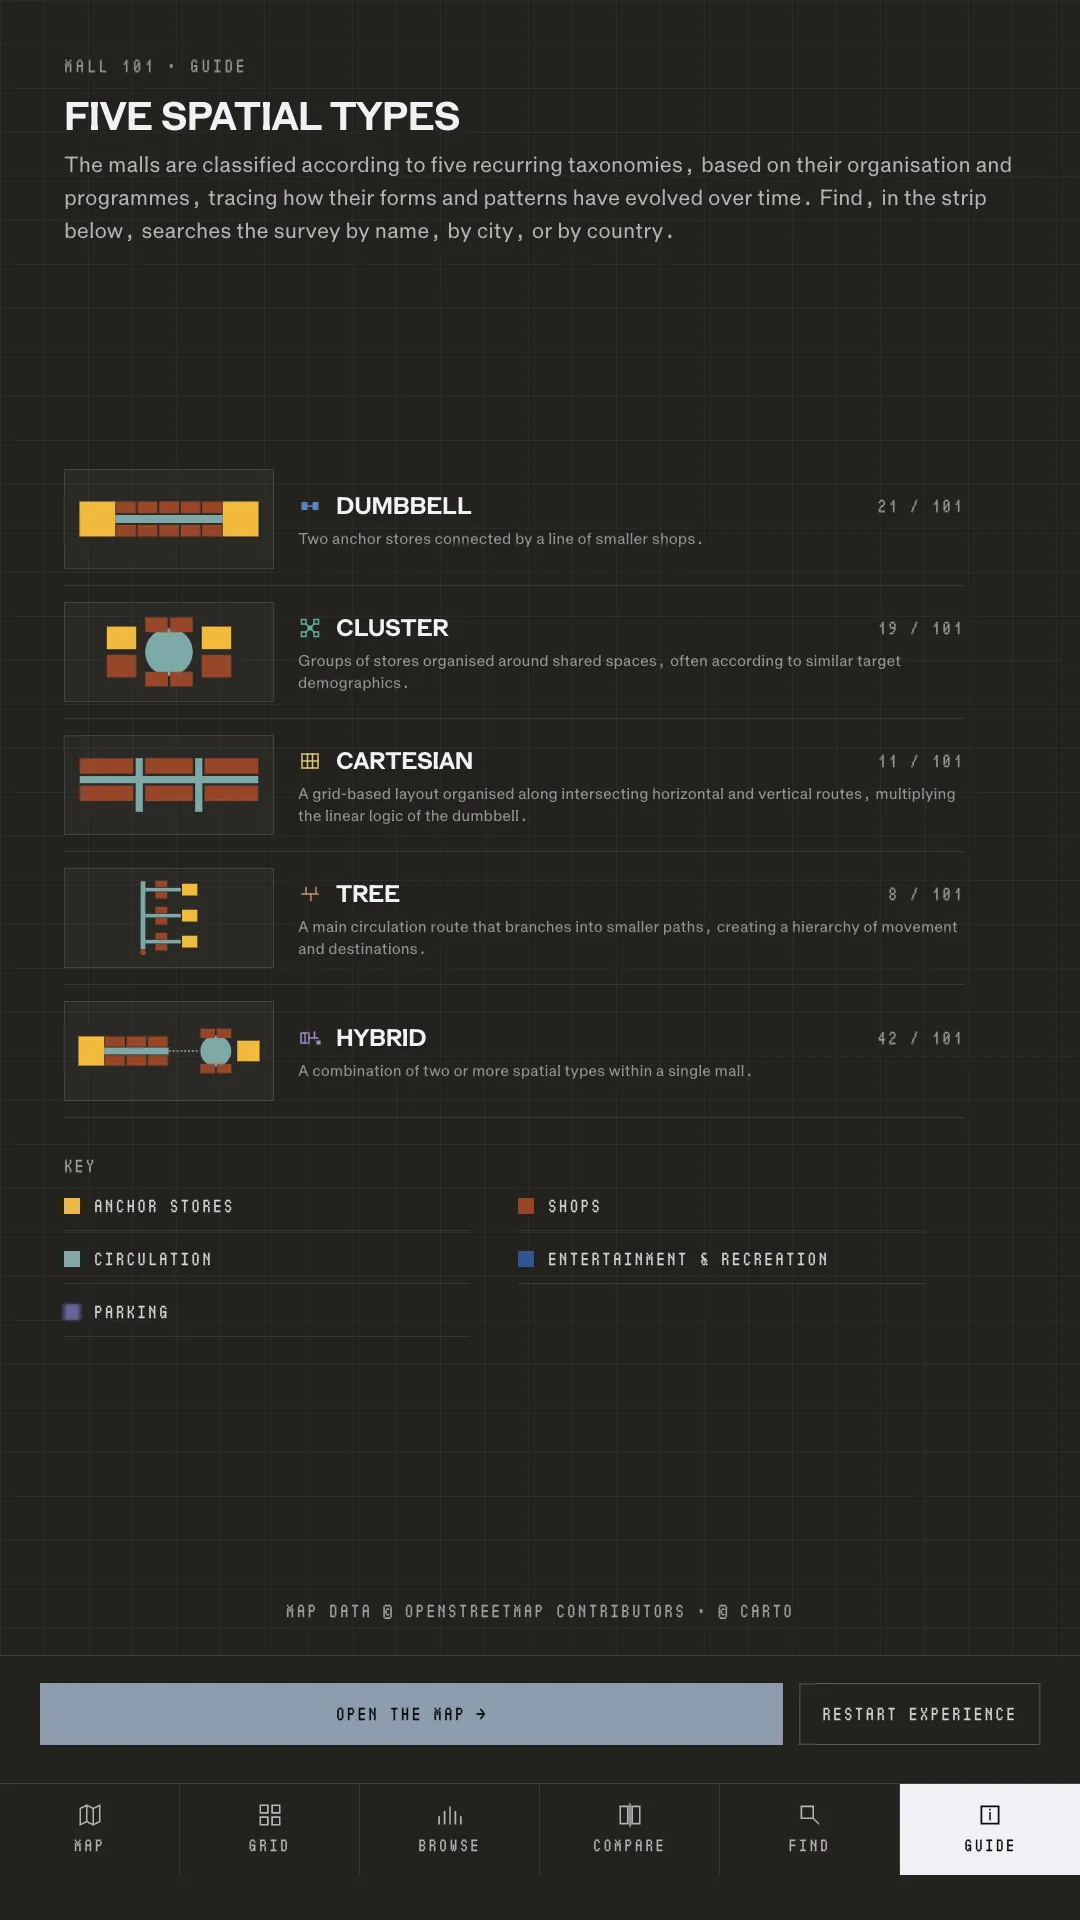
Guide: the five spatial types with their counts, and the colour key for the plans
[ Guide ]
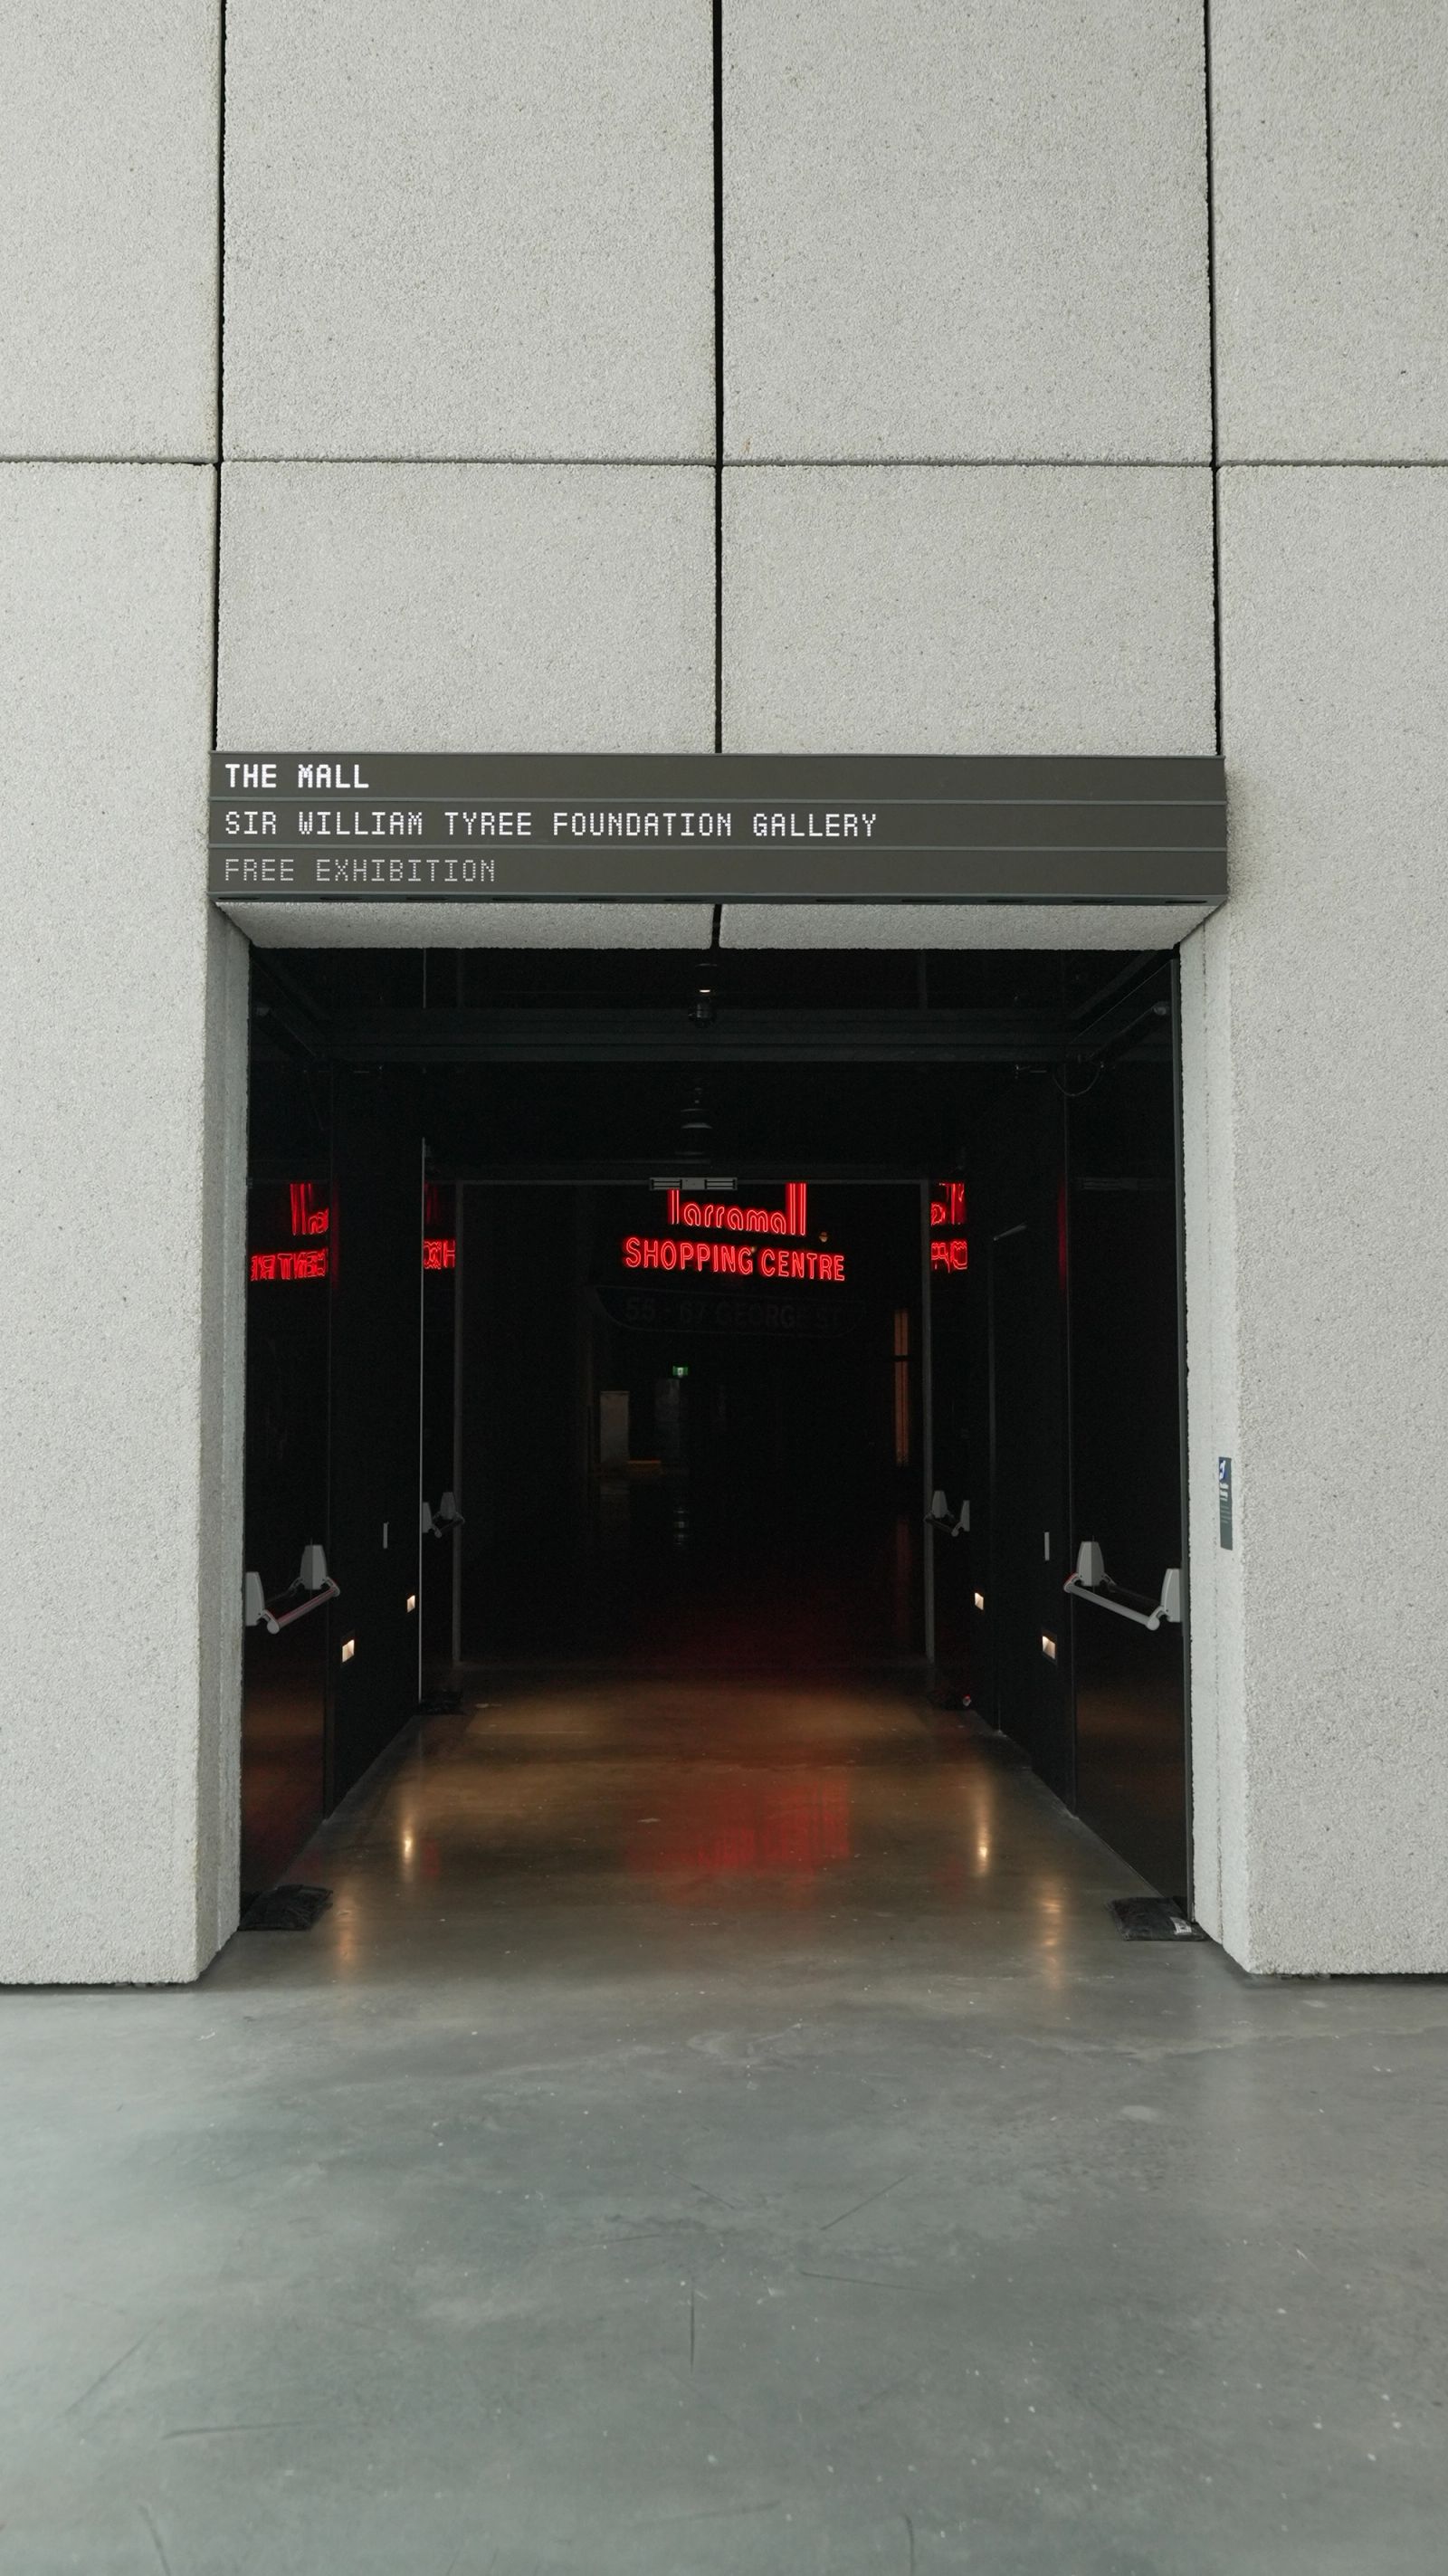
Entrance to The Mall in the Sir William Tyree Foundation Gallery: the exhibition sign over a dark corridor lit by red neon shopping centre signs
[ Entrance to The Mall ]
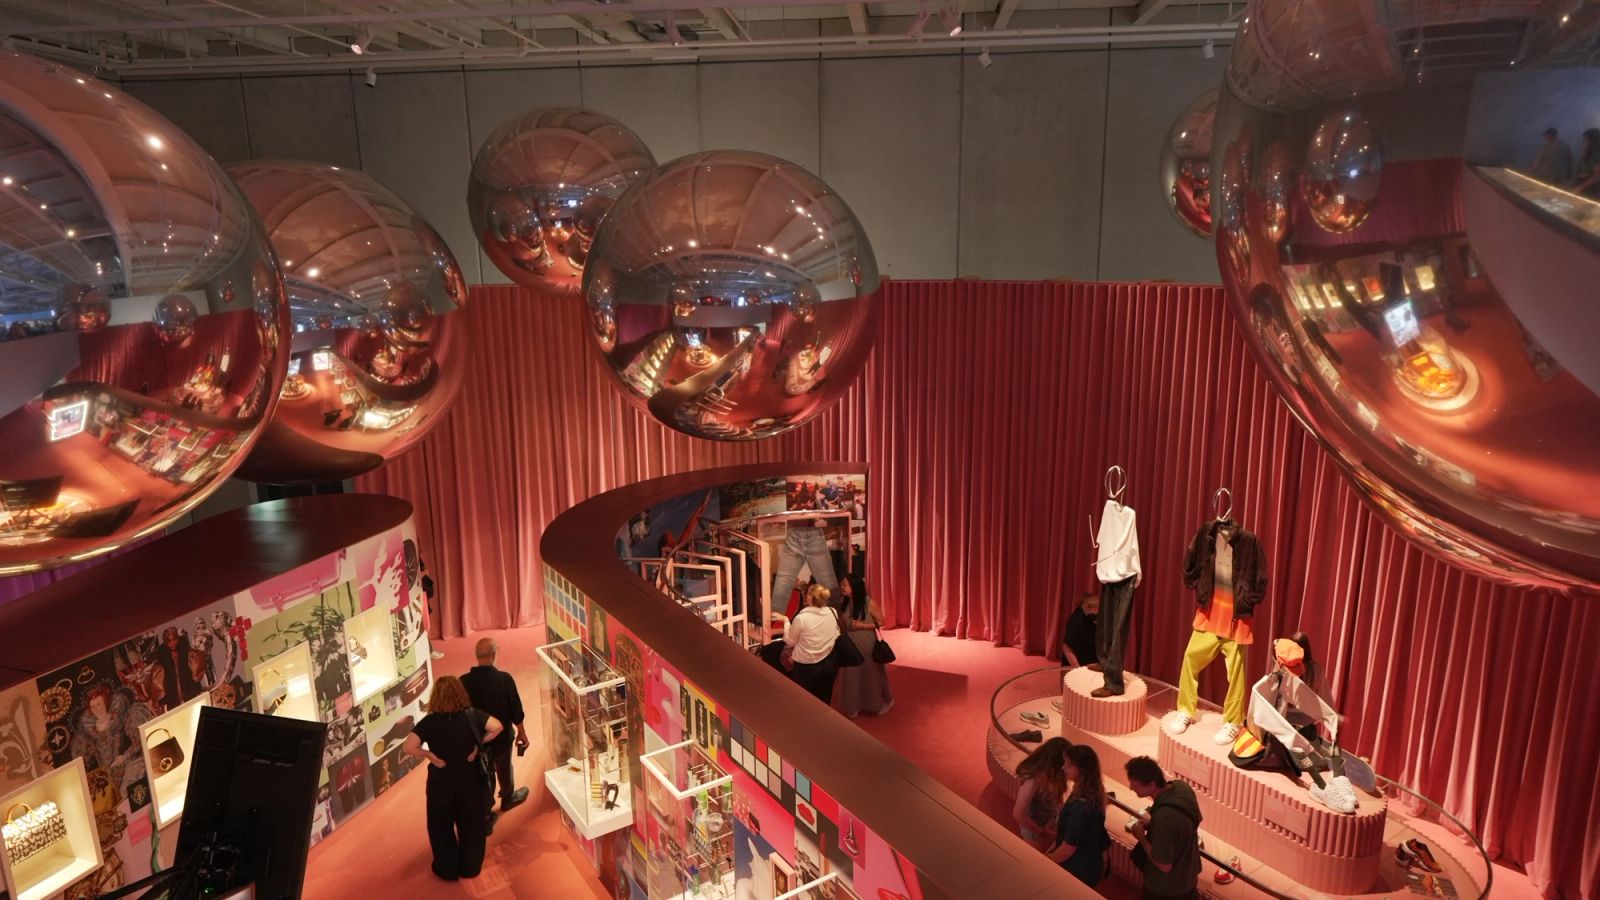
Looking down into The Mall: giant mirrored spheres hang over a curved display wall, pink velvet curtains and mannequins on round plinths
[ Inside The Mall ]
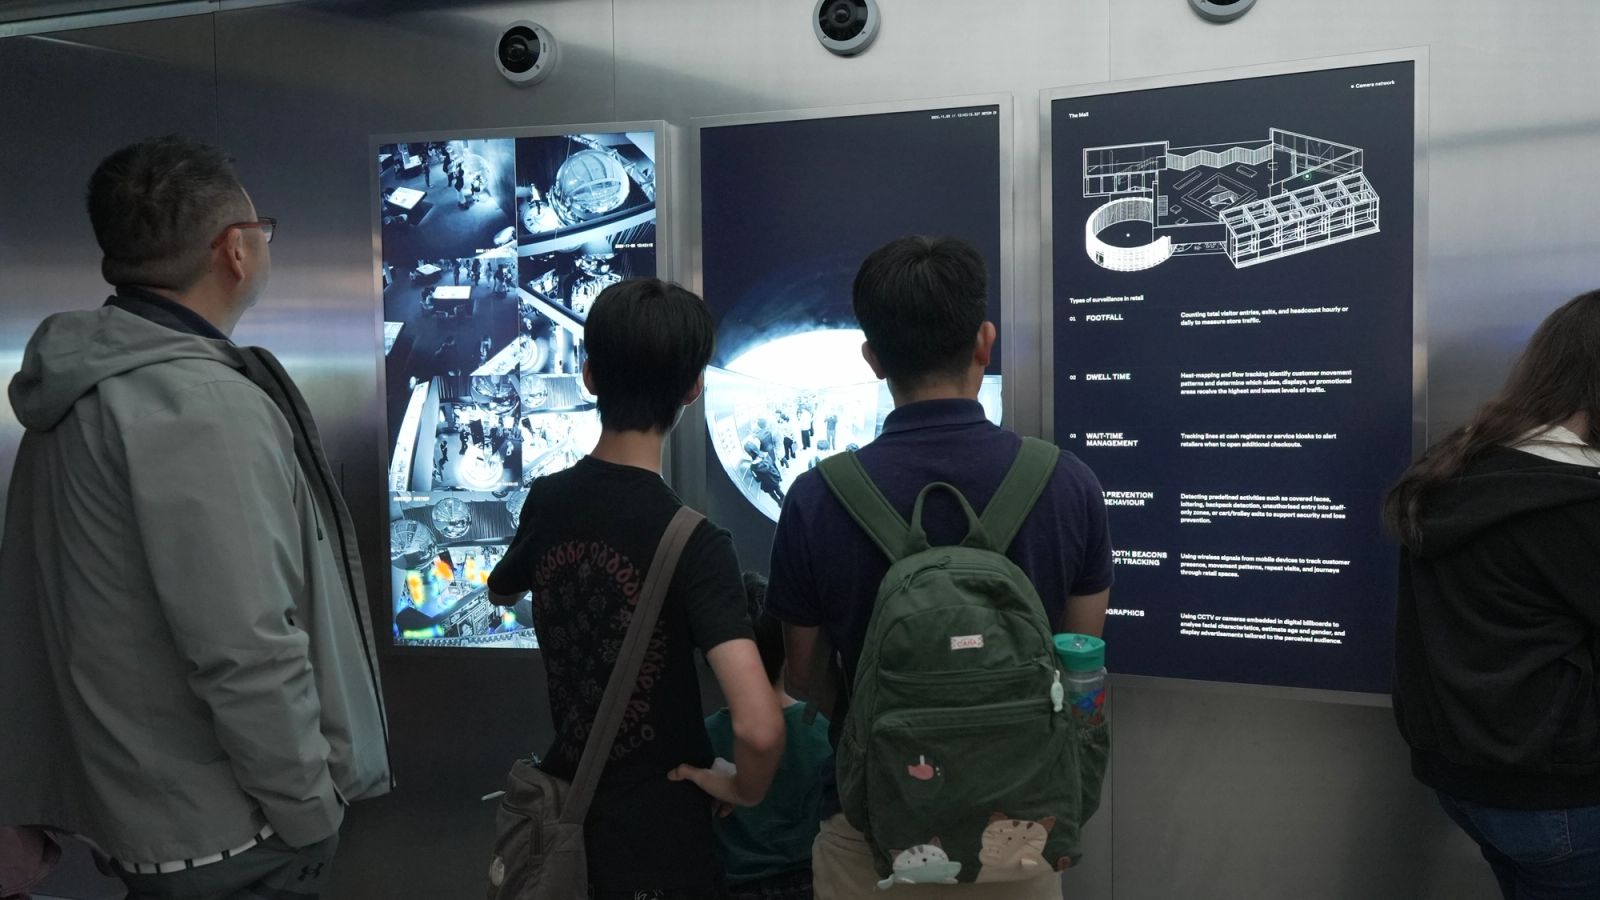
Visitors reading wall screens under ceiling cameras: camera footage, a globe, and a panel listing types of surveillance in retail such as footfall and dwell time
[ Types of surveillance in retail ]
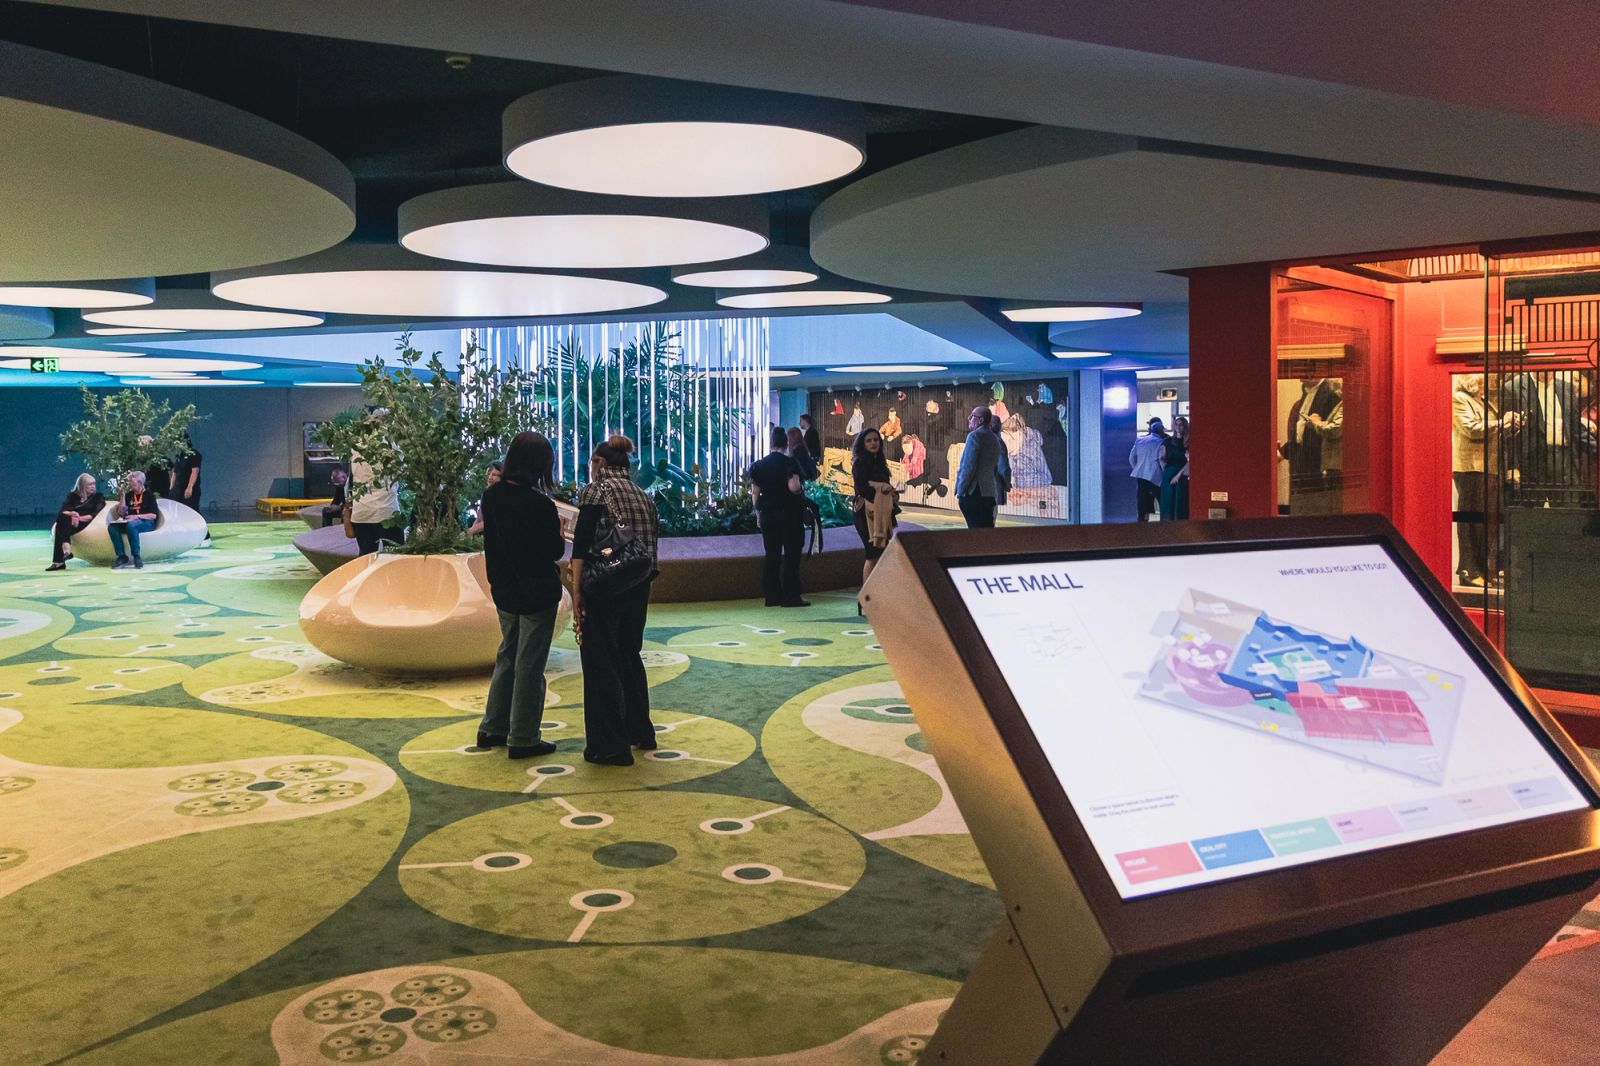
A freestanding touchscreen titled The Mall showing a coloured floor plan, with visitors, round seating pods and green patterned carpet behind it
[ On the exhibition floor ]

[ By the Numbers ]

  • 101 malls from 1957 to 2023, in 48 countries across 8 regions

  • Five spatial types: dumbbell, cluster, Cartesian, tree and hybrid

  • 101 satellite photos and 303 crops, served from Cloudflare R2

  • Tap targets of 62 px or more, all within the bottom 60% of the screen

  • Idle reset at 90 seconds, heartbeat every 5 minutes